How We Took Our Own Homepage from a Page Speed Score of 38 to 93
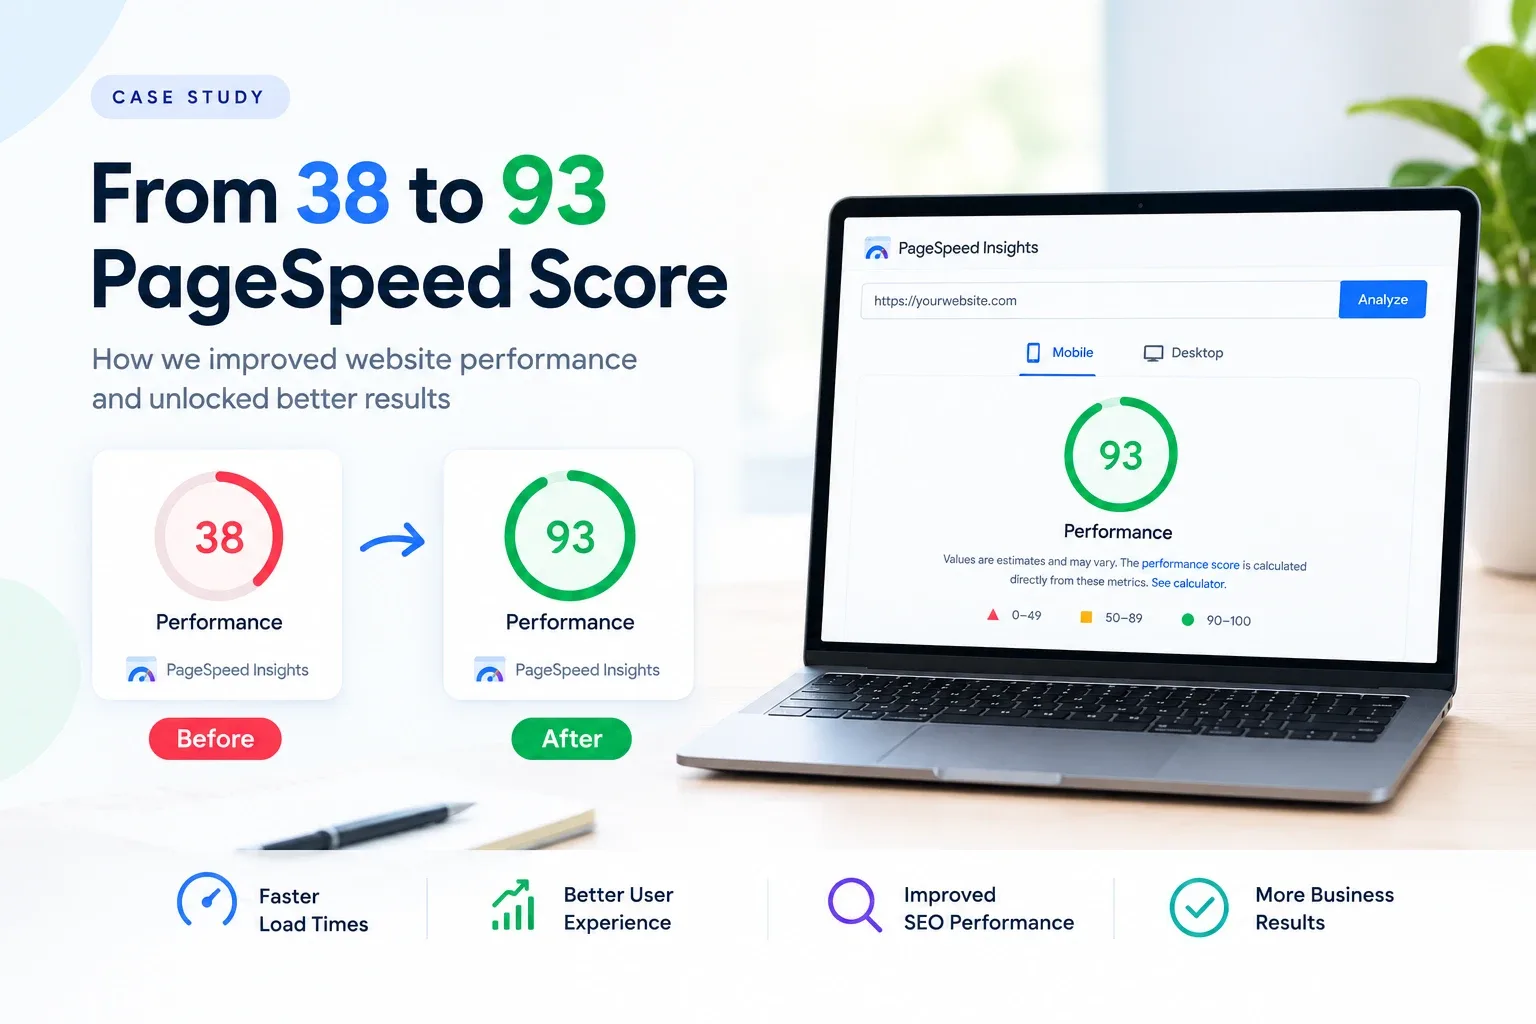
Quick answer: On 2 October 2026 our homepage scored 38 out of 100 on mobile in Google PageSpeed Insights, the page speed test most site owners use. The largest paint took 12.3 seconds and the layout shift score was 1.106. A day later it scored 93, with a 2.7 second largest paint and a layout shift of 0.009. The images and the server were never the problem. The page arrived complete, and JavaScript then threw it away and drew it again.
This is a write-up of our own site, measured by us. Every figure is a lab measurement of the homepage, from PageSpeed Insights or from Lighthouse run on our own machine, and each one is labelled. There is no real-visitor data yet, and the last section says what that means.
Page speed test results, before and after
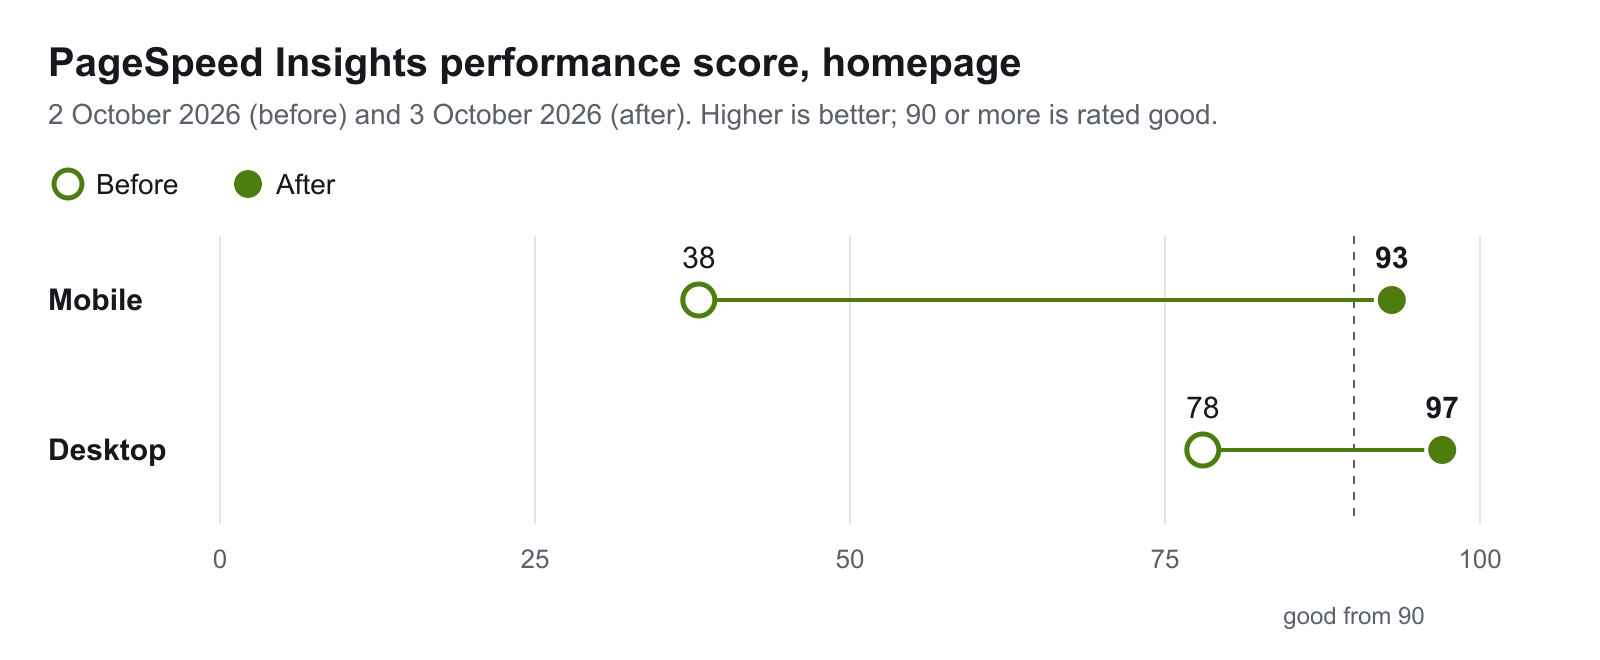
| PageSpeed Insights, homepage | 2 October 2026 | 3 October 2026 |
|---|---|---|
| Mobile performance score | 38 | 93 |
| Mobile Largest Contentful Paint | 12.3 s | 2.7 s |
| Mobile Cumulative Layout Shift | 1.106 | 0.009 |
| Mobile Total Blocking Time | 170 ms | 50 ms |
| Mobile First Contentful Paint | 2.0 s | 2.0 s |
| Desktop performance score | 78 | 97 |
| Desktop Largest Contentful Paint | 2.1 s | 0.7 s |
Two of those lines matter most. Largest Contentful Paint (LCP) is the moment the biggest piece of content on the first screen appears. Cumulative Layout Shift (CLS) measures how much the page jumps around while it loads. Both are part of Google's Core Web Vitals, and its guidance is to keep LCP within 2.5 seconds and CLS below 0.1. We were at roughly five times the first limit and eleven times the second.
Why was the Largest Contentful Paint so slow?
The first thing we checked was the usual list from our guide to why websites are slow: image sizes, caching, server response. None of it applied. The images were already compressed, the pages were cached, and the server answered in about 140 milliseconds.
Notice the one mobile line in the table that did not change. First Contentful Paint was 2.0 seconds both days. Something appeared on screen quickly. The page then took another ten seconds to settle. That gap pointed at JavaScript, and there were two separate faults in it.
The page was being drawn twice. The site was designed in a visual site builder and exported. The server sends complete HTML, and then the builder's JavaScript, about 400 KB of it, loads and takes over the page so that animations and menus work. That takeover only works cleanly when the HTML is exactly what the JavaScript expects. Ours was not, because we had removed template sections and rewritten copy since the export. So the JavaScript discarded the page and drew it again. The browser counts the redrawn content as the largest paint, which means the LCP clock kept running until every script had downloaded and run. On the slow phone that PageSpeed Insights simulates, that took 12.3 seconds.
Our own scripts made the page jump. We had small scripts that corrected content after the page loaded. They ran before the builder's JavaScript had attached, which caused it to throw away the top section of the page and rebuild it. That one event accounted for about 1.0 of the 1.106 layout shift. The rest came from a button that was inserted under the opening paragraph after load and pushed the content around it by about 190 pixels.
Fix one: stop the page jumping
This was the smaller job. We made the correcting scripts wait until the builder's JavaScript had attached, hid the elements they were going to remove with CSS so nothing visibly disappeared, and reserved the space for the button before it arrived.
Layout shift fell from about 1.1 to 0.008 in our own Lighthouse runs, and the mobile score rose from the 17 to 38 range into the 50s. The largest paint was still around 9 seconds, because the page was still being drawn twice.
Two things we tried that did not help
Before the larger fix, we tried two cheaper ones:
- showing the opening text immediately, without its entrance animation
- deferring more of the scripts
Neither moved the largest paint in our measurements, so neither was shipped. This is worth saying because both are standard advice. They are good advice when the animation or the script order is what the paint is waiting for. Here the paint was waiting for a redraw, and reordering scripts does not remove a redraw.
Fix two: how we fixed the Largest Contentful Paint
To fix the Largest Contentful Paint we had to stop the double draw, and there were two ways to do it. One was to make the HTML match what the builder's JavaScript expected, which meant putting back template content we had deliberately removed. The other was to stop loading that JavaScript and serve the page as plain HTML.
We tested the second option with a throwaway copy of the homepage before committing to it. With the JavaScript switched off and nothing else changed, two Lighthouse mobile runs gave:
| Lighthouse, mobile, our own runs | With the builder's JavaScript | Prototype without it |
|---|---|---|
| Performance score | 52 to 58 | 84 and 97 |
| Largest Contentful Paint | 9.0 to 9.3 s | 2.0 s and 3.9 s |
| JavaScript execution time | 3.4 s | 0.3 s |
| Main-thread work | 7.0 s | 1.8 s |
Two runs is a small sample, and they disagreed with each other. It was still enough to show where the time was going.
The prototype was not something we could publish. Without the JavaScript, the intro screen never cleared and left the page black, the animated word in the headline stayed invisible, and the phone menu did not open. Everything that JavaScript had been doing needed to be rebuilt:
- the intro screen and the opening animation of the first section, in CSS
- the rotating word in the headline
- the scroll effects: text that reveals letter by letter, and images that uncover and drift as you scroll
- hover effects on navigation links, buttons and cards
- the phone and tablet menu
- smooth scrolling, on devices with a mouse wheel only
Some content also had to move. The main photo at the top of the page had been swapped in by JavaScript after load, so we put it in the HTML and added a smaller copy for phones. Sections that scripts used to build in the browser, including the project tiles and the questions and answers, were written into the HTML the server sends.
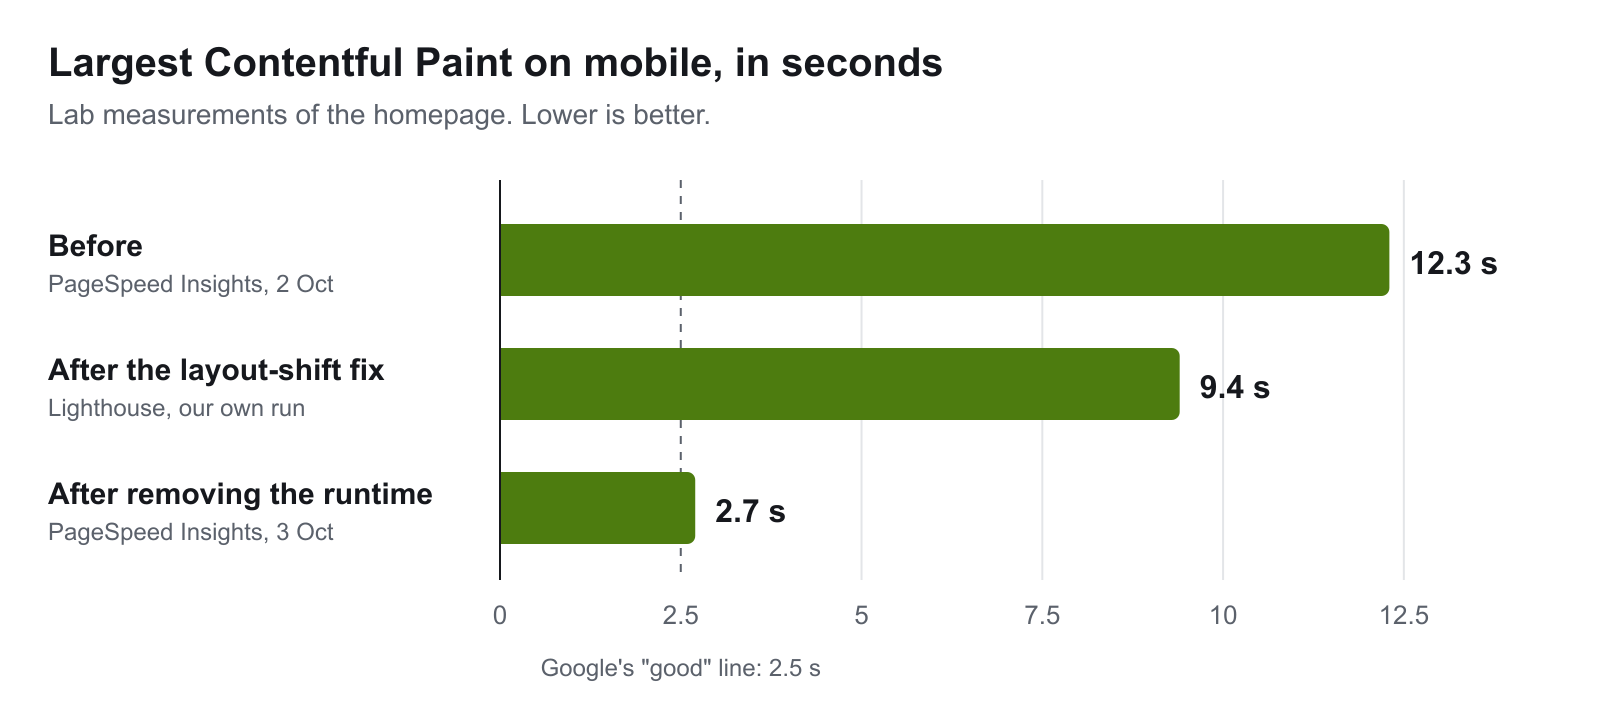
The middle bar is from Lighthouse on our own machine and the other two are from PageSpeed Insights, so read it as an approximate midpoint and not a like-for-like figure.
How did we check that nothing else changed?
A faster page that looks different, or whose enquiry form has stopped working, is not an improvement. Before release we compared the new homepage with the old one at phone, tablet and desktop widths:
- the total page height at each width
- the visible text, line by line
- every link and image
- hover reactions, and the scroll effects at several points down the page
- the enquiry forms, by confirming they send the same request as before
It went to a staging copy of the site first and was released after those checks passed. The same approach was then applied to the About, Projects and Contact pages.
Does a score of 93 mean the site passes Core Web Vitals?
Not yet, and a score cannot show that.
It is a lab result. PageSpeed Insights loads the page once on a simulated mid-range phone and a slow connection. Google describes Core Web Vitals as measuring real-world experience, and that assessment uses data from actual visitors over 28 days. Our site does not have that data yet, so we cannot say it passes.
The largest paint is close to the line, not under it. 2.7 seconds on mobile is still above 2.5. Our own runs before release ranged from 2.0 to 2.7 seconds.
Scores vary between runs. The live homepage, which also loads analytics, scored between 64 and 87 in Lighthouse on our own machine on the day PageSpeed Insights gave it 93. One run of any speed test is a reading, not a verdict.
Core Web Vitals are not a ranking guarantee. Google's documentation says good Core Web Vitals align with what its ranking systems seek to reward. It does not promise that a faster page will rank higher, and neither do we. The benefit we can stand behind is simpler: on a phone, the page now appears in under three seconds in a lab test, where it used to take twelve.
Did this need a website redesign or a rebuild?
Neither, in the usual sense. A website redesign changes how the site looks and what it says. A website rebuild replaces the platform underneath it. We kept the design, the content and the hosting, and changed one thing: how four pages are delivered to the browser.
That matters if a slow site has you weighing up a rebuild. A poor page speed score does not tell you which of the three you need. Ours looked like a platform problem, and the fix was still much smaller than starting again. Our guide to website redesign vs rebuild covers how to tell them apart.
What to take from this for your own site
If you are starting Core Web Vitals optimisation on your own site, this is the order we would work in:
- Find out what the largest paint is waiting for before you fix anything. PageSpeed Insights names the element. If the first paint is fast and the largest paint is very late, look at JavaScript before images.
- Be wary of content that is added or replaced after the page loads. Each replacement can delay the largest paint, shift the layout, or both.
- If your site came from a visual builder or a template export, check whether the page is drawn twice. It is more likely the more the content has been edited outside the builder since.
- Test a cheap prototype before a large change. Ours took a few hours and showed that the fix would work and what it would break.
- Measure more than once, and compare like with like. Use the same tool and the same settings before and after.
- Check that the page still looks and works the same. Speed work that breaks a menu or a form costs more than it gains.
Speed is one item on a longer list. Our technical SEO checklist covers the rest of what search engines need from a site.
Want your site looked at the same way?
Run your homepage through PageSpeed Insights on mobile and note the largest paint and the layout shift. If either is well outside Google's marks and the usual fixes have not moved it, get in touch and send us the result. Our Web Design Adelaide service includes this kind of diagnosis for new builds and existing sites.
Work With wow.digital
If you would rather have this handled for you, these pages explain what we do and where we work:
Keep Reading
Frequently asked questions
What is a good PageSpeed Insights score?
PageSpeed Insights rates a performance score of 90 to 100 as good, 50 to 89 as needs improvement and below 50 as poor. The score is a lab test of one page load. Google's Core Web Vitals, measured on real visitors, are the figures that describe the experience people actually get.
How do I check my page speed and Core Web Vitals?
Enter the page address at pagespeed.web.dev, Google's free page speed test. The top of the report shows the Core Web Vitals assessment from real visitors, if the page has enough of them. The section below it is the lab test. Read the mobile result first, and look at Largest Contentful Paint and Cumulative Layout Shift before the overall score. Test more than once, because results vary between runs.
Why was the largest paint so slow when the server was fast?
The page arrived from the server complete, then a site-builder's JavaScript redrew it. The browser counts the redrawn content as the largest paint, so the measurement waited for all of that JavaScript to download and run. On a simulated mid-range phone that took about 12 seconds.
Did fixing the page speed need a website redesign?
No. This was neither a website redesign nor a full website rebuild. The layout, text, images, animations and hover effects were rebuilt to match, then compared with the old version at phone, tablet and desktop widths before release. The changes a visitor can notice are that the page appears sooner and no longer jumps.
What does 'Core Web Vitals assessment: failed' mean?
It is PageSpeed Insights' verdict on real visitor data from the previous 28 days. It shows failed when Largest Contentful Paint, Interaction to Next Paint or Cumulative Layout Shift is outside Google's good range for too many visits. It is separate from the performance score. To fix it, find which of the three is failing and what that metric is waiting for.
Is a PageSpeed score of 93 the same as passing Core Web Vitals?
No. The score is a lab result. Core Web Vitals are assessed on real visitor data collected over 28 days. Our lab largest paint of 2.7 seconds on mobile is still slightly above Google's 2.5 second mark, and the site has no real-visitor data yet.
Can a slow site built with a site builder be fixed without rebuilding it?
Often, yes. Start by measuring what the largest paint is waiting for. If it is images or third-party scripts, those can be fixed in place. If the builder's own JavaScript redraws the page after it loads, the choice is between making the server HTML match what that JavaScript expects or serving the page without it.